
A huge aspect of digital marketing is controlled by data. You can create custom online campaigns to make your business thrive beyond the competition, SEO ranking, with the right data. It shows you stats about what’s obtainable in your digital campaign and what isn’t.
One of the biggest challenges of data is visualizing it and tweaking it to achieve your objectives. This is where Google Data Studio comes in. What is Google Data Studio?
It’s an innovative tool that allows you to create interactive, responsive, and customizable dashboards and reports. One of the major duties of the data studio is to transform raw, unprocessed data into information that aids strategy and decision-making for brands and corporate organizations.
This article will explore all you need to know about the Google data studio console and how to use it.
What Are the Benefits of Using Data Studio?
Google data studio custom visualization comes with several benefits and key features you should explore. Some of these benefits include:
● Free. One of the unique benefits of the data studio is that it is absolutely free. You don’t need to pay to get access to any premium features.
● Live data connections. The data studio also has access to over 200 connectors and web devices.
● Control over visualization. Google data studio custom visualization is unique, giving you more control over reports, insights, and dashboards.
● Reveal advanced metrics. The data studio also provides you with advanced, calculated metrics and fields you can customize to your satisfaction. You also get dynamic controls with page level and report filters.
These benefits make google data studio templates suitable for data reporting and monitoring.
How to Use Google Data Studio
Taking full advantage of Google visual data studio, you need to know how to use it in the first place. We will show you how:
● Log in to the data studio. Log in to Google Data Studio with your Google account to get started. If you don’t have a Gmail account, you can create one here.
● Explore the dashboard. The dashboard of Google sheets and data studio look somewhat alike. The platform contains google data studio templates and tutorials to get started.
● Connect your data source. There are several Google Data Studio data sources you can connect to and explore. Click the create icon and choose the data source.
● Create your first report. After connecting to a data source, you can make your report by adding content to the data.
● Add charts. The data studio also allows for visual aesthetics, so you can include graphs and charts to make your reports and dashboards more robust.
● Share it. You can share it with your colleagues and friends when you’re done with the report. You can copy the link by emailing it or adding their accounts to the file permissions.
There you have it. Follow the above tips to create and take advantage of the data studio.
How to Access Google Data Studio
To access google data studio examples and data sources, you need to have a Google account and log in to the platform.
On the left side, there’s a menu that you can explore:
● Reports. You can access your reports. They are styled to look like Google sheets or the typical workbook in Tableau.
● Files from your PC. You can modify files saved on your PC. All you have to do is upload it to your Google data studio.
● Data sources. This section lists over 400 connections you use as a data source for your reports.
Google Data Studio Data Sources
Google data studio data sources are platforms or tools where your recorded data is. If you have files saved on your Google sheets, that becomes an example of a data source for google data studio.
Beyond the templates, google data studio allows you to connect to over 400 data sources, including google ads, cloud spanner, google sheets, BigQuery, SEMrush, HubSpot, Google My Business, Campaign Manager 360, and many more.
To check them out, click the Create icon and click Data sources. You will discover all of them there. Using google data studio with google analytics, you can take advantage of several features.
How to Connect Data Sources to Google Data Studio
After logging into the platform, you’d want to connect data sources to the google data studio console to create a report or dashboard. But you need to identify the data source you want to work with.
To get started, click Create > Data Source.
You will find a lot of data platforms you can curate data from. Use the search bar to quickly find the data source you want to use. For the sake of this google data studio tutorials, we’d be using Google Sheets as a data source and selecting the New Followers spreadsheet showing followers from different social media platforms.
After selecting the file to explore, Google Data Studio will showcase a page where you can create and conduct visual customization on the file selected. You can add graphics, charts, text, layout and other customizations.
When you’re done adding google data studio custom visualization, you can name the document and share it. You can either download it as a PDF, embed the report into your website, invite other google accounts, or send the report to others.
Google Data Studio Custom Visualization
One of the uniqueness of the google data studio is that you are in full control to customize any data source connected. With the Data Studio, you can add:
● Tables
● Scorecard
● Bar
● Google Maps
● Geo charts
● Charts
● Data from other data sources, and more.
Many tech whitepapers and financial records are created using google data studio financial dashboard and reports.
Google Data Studio Report Level Filter
Most Google data studio reports span across different pages. Every chart on the same page applies the same filter in the default settings. But it’s quite different if a user visits another page.
To ensure that the same filter is used across the board, right-click on any chart and select ‘Make report level’ to maintain the same google data studio report level filter across the same report.
Google Data Studio Example Reports
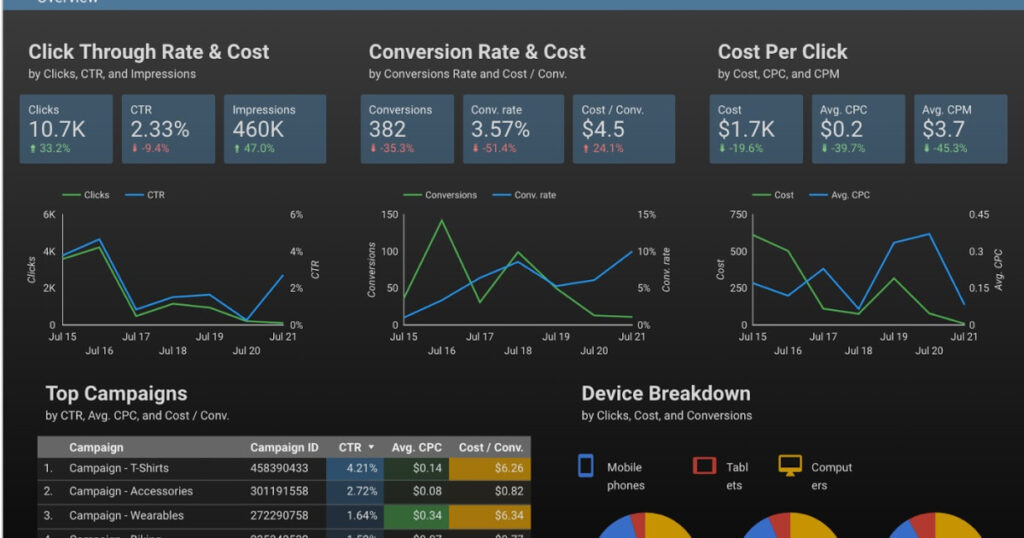
One of the unique benefits of google data studio is that you can create a host of reports based on the data received from data sources. For instance, you can use the data studio to create a comparison dashboard between the ads campaign from different social media platforms.
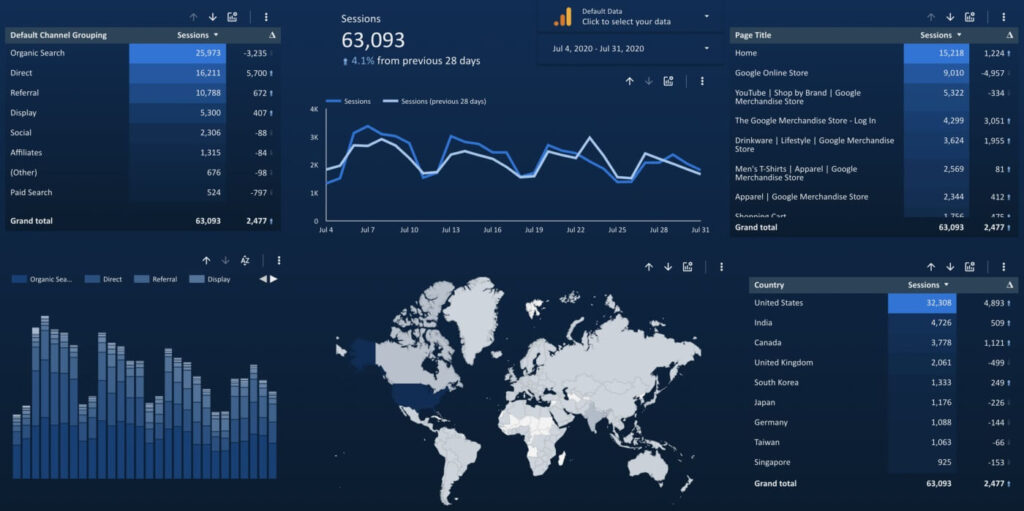
You can also use the data studio to create social media and organic search performance after curating the data from Google Analytics. You can create KPIs for your marketing team to review and work with.
There are free google data studio example reports you can tweak on the platform.
Using Google Data Studio With Google Analytics
People often compare data studio vs google analytics, but they are distinct in their functionalities. Google Analytics allows you to identify trends and how users interact with your website, google data studio helps curate data into a customized report.
Follow these steps to connect your google analytics to google data studio:
● Sign in to Google Data Studio.
● Click the Create icon and select a data source.
● Select Google Analytics from the list of data sources.
● Authorize the connection and select an account.
● If you want to connect to Universal Analytics, select a view and click CONNECT.’
● You can select the data you want to customize from the web analytics.
There are also google data studio tutorials you can practice to create a report using the tool.
Conclusion
Google Data Studio is an innovative platform you can use for data integration, transformation, visualization, and sharing. Practice the above tips to get started.


